Introduction
According to the American Society for Quality (ASQ), poor quality control—driven by measurement errors that produce scrap, rework, and warranty claims—consumes 15% to 20% of total sales revenue for average manufacturers. Every measurement in a lab, machine shop, or production facility carries some degree of error. The question is whether you're quantifying it. A single miscalibrated CNC probe or worn gauge can inflate percent error across an entire production run, turning precision parts into expensive scrap before anyone notices the drift.
Understanding percent error, the accuracy vs. precision distinction, and the formula behind the calculation gives you the tools to catch those problems early. This article breaks down each concept and explains why they matter beyond the classroom—particularly in manufacturing and quality-sensitive operations where tolerances are measured in millionths of an inch.
TL;DR
- Percent error measures how far a measured value deviates from a known true value, expressed as a percentage
- Accuracy refers to correctness (how close to the true value); precision refers to repeatability (how consistent measurements are)—these are not the same
- Percent error captures accuracy only—it tells you nothing about whether measurements are consistent
- Systematic errors (like miscalibrated instruments) skew results in one direction and cannot be averaged away
- Random errors scatter unpredictably but shrink with repeated measurements
- In manufacturing, even small percent errors cause rejected parts, rework costs, and equipment failure; calibrated, traceable measurements prevent this
What Is Percent Error?
Percent error measures how far a result strays from the true or accepted value, expressed as a percentage. The core question it answers: how far off was my measurement from what it should have been?
Two values are required:
- Experimental or measured value — what you observed or measured
- True or theoretical value — the accepted correct value
When the true value is unknown, other methods like measuring variability or standard deviation must be used instead.
Where percent error is used:
- Scientific experiments comparing results to known physical constants
- Quality control environments comparing measurements to design specifications
- Calibration labs and metrology environments where instruments are verified against NIST-traceable reference standards
- Manufacturing facilities verifying that production equipment hits intended targets
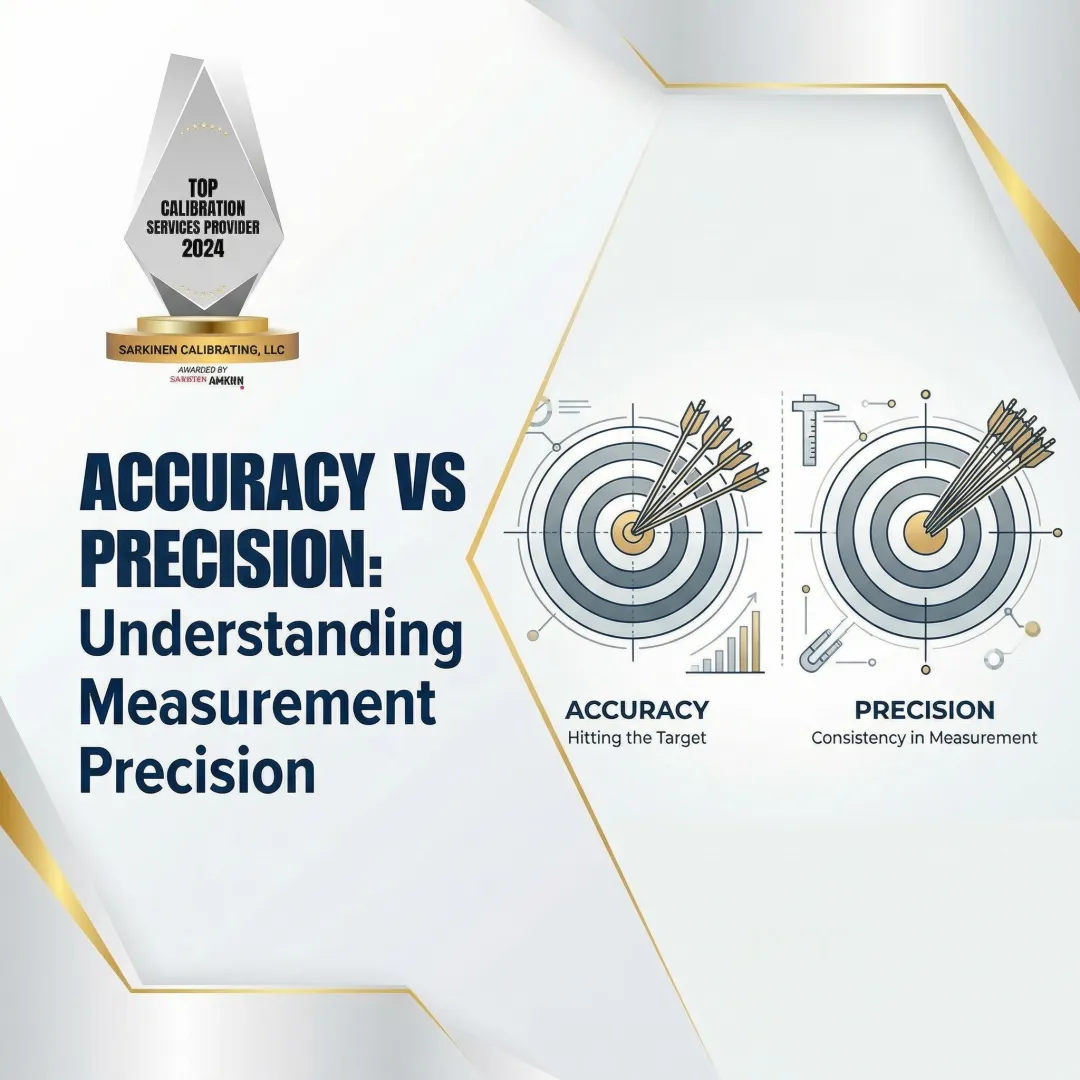
Accuracy vs. Precision: Why the Difference Matters
Accuracy and precision sound similar but describe fundamentally different aspects of measurement quality. Confusing them leads to misdiagnosed problems and wasted resources.
Accuracy: Correctness
Accuracy measures how close a single measurement (or the average of multiple measurements) is to the true value. It reflects the correctness of the result, not its repeatability. A highly accurate measurement system consistently delivers results near the true value.
Precision: Repeatability
Precision measures how consistent or repeatable measurements are with one another. A highly precise instrument produces nearly the same reading every time, regardless of whether that reading is actually correct. Precision describes scatter, not correctness.
The Dartboard Analogy
Imagine throwing darts at a bullseye:
- Accurate and precise — tight cluster centered on the bullseye (ideal scenario)
- Precise but not accurate — tight cluster consistently off-center (systematic error)
- Accurate but not precise — scattered hits averaging near the bullseye (random error)
- Neither accurate nor precise — scattered hits away from the bullseye (multiple error sources)
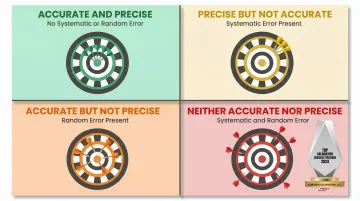
Each scenario points to a different root cause — and that distinction determines how you fix it.
Systematic Error vs. Random Error
The accuracy/precision split is caused by two fundamentally different error types.
Systematic error creates a consistent bias in one direction — the same offset, every time. Common sources:
- A worn or miscalibrated instrument that reads consistently high or low
- Environmental factors like uncorrected temperature drift
- Operator technique that applies consistent force or alignment errors
Averaging multiple measurements does not fix systematic error. If your micrometer reads 0.002 inches too high, taking 100 measurements and averaging them still gives you a result that's 0.002 inches too high.
Random error is unpredictable and varies between measurements. Common sources:
- Electrical noise in sensors
- Minor variations in operator technique
- Environmental fluctuations like vibration or air currents
Unlike systematic error, random error can be reduced by averaging repeated measurements — positive and negative deviations tend to cancel out over time.
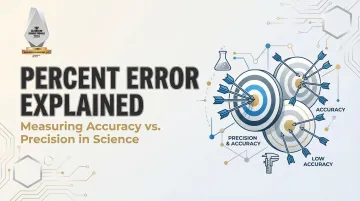
Does Percent Error Measure Accuracy or Precision?
Percent error measures accuracy. It tells you how far off your result is from the true value, not how consistent your measurements are. Precision is better described by standard deviation or the spread of repeated measurements. A measurement can be highly precise (repeatable) but consistently inaccurate if systematic error is present.
How to Calculate Percent Error: Formula and Examples
The percent error formula is straightforward but requires careful attention to which value goes where.
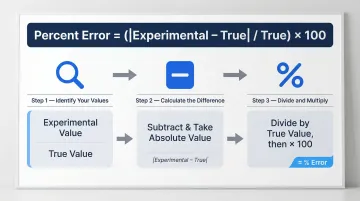
Percent Error Formula:
Percent Error = (|Experimental Value − True Value| / True Value) × 100Formula components:
- Numerator: The absolute difference between measured and true values
- Denominator: The true value, which normalizes the error relative to the scale of the measurement
- Multiply by 100: Converts the decimal result to a percentage
Absolute Value Convention
Using absolute value always produces a positive result. This matters when averaging multiple measurements — without it, positive and negative errors cancel out and mask the true average error.
Some fields omit absolute value to preserve directional information:
- Positive result means the measurement was too high
- Negative result means the measurement was too low
Check the convention for your specific application.
Step-by-Step Calculation
- Identify your values. Determine the experimental (measured) value and the true (accepted or theoretical) value. The true value must be a known, verified reference — not another estimate.
- Calculate the difference. Subtract the true value from the experimental value. Take the absolute value of this result unless directional sign is needed for analysis.
- Divide and multiply. Divide the absolute difference by the true value, then multiply by 100 to express as a percentage.
Example:
An inspector measures a reference part at 5.2 mm against a known standard of 5.0 mm.
Percent Error = (|5.2 − 5.0| / 5.0) × 100Percent Error = (0.2 / 5.0) × 100Percent Error = 0.04 × 100Percent Error = 4%What this means: The measurement was 4% too high. If this error is consistent across multiple measurements, it indicates systematic error—likely a calibration problem.
Why Percent Error Matters in Manufacturing and Quality Control
In manufacturing, the "true value" is typically a part specification, a calibration standard, or a reference established by bodies like NIST (National Institute of Standards and Technology). Percent error directly reflects whether production equipment is hitting its intended targets—and a consistent percent error in one direction is a red flag for systematic instrument error, not just human variation.
Real-World Consequences of Undetected Percent Error
Manufacturing facilities face serious financial and operational consequences when measurement errors go undetected:
- Parts that fall outside tolerance specifications and fail quality inspections
- Increased rework and scrap costs that consume material budgets
- Warranty violations on new machinery that remain undiscovered until production begins
- Downstream safety risks when out-of-tolerance components reach customers
According to ASQ, quality issues consume 15% to 20% of total sales revenue for average manufacturers. Out-of-tolerance parts drive up material scrap, which typically accounts for 3% to 10% of total material costs. For a facility with an $8 million annual materials budget, a 6% scrap rate equates to nearly $480,000 lost per year.
The 10-to-1 Calibration Ratio Principle
For a measurement to be trusted, the measuring instrument should be at least 10 times more accurate than the tolerance it is measuring. When this ratio is not maintained, percent error grows silently until it produces defects.
The legacy 10:1 Test Accuracy Ratio (TAR) from MIL-STD-120 has since been replaced by the 4:1 Test Uncertainty Ratio (TUR) in ANSI/NCSL Z540.3. TUR is more reliable because it accounts for the expanded uncertainty of the entire measurement process—including environmental factors, equipment repeatability, resolution, and operator error—rather than just instrument specifications.
Calibration providers who measure well beyond this ratio (such as achieving accuracy to 1 part per million) provide a meaningful safety margin for high-precision production environments. This keeps the calibration equipment itself from adding to measurement uncertainty.
Preventive Maintenance and Calibration Schedules
Maintaining the correct TUR is only part of the equation—instruments also drift over time due to wear, environmental exposure, and mechanical stress. Systematic errors develop gradually, which means they often go unnoticed until defects are already in production.
Regular calibration against NIST-traceable standards catches this drift early, transforming percent error from a reactive discovery into a proactively managed metric.
The stakes are measurable. One large electronics manufacturing services (EMS) company struggled with a 75% first-pass yield caused by skewed component placements. An offline metrology system revealed the machine's true capability (Cpk) was below 1.0, projecting 56,000 Defects Per Million Opportunities (DPMO). After calibrating the machines using traceable offsets, Cpk rose to 2.5 (3.4 DPMO) and first-pass yield jumped to 89%—saving the facility $35,000 per month in rework and maintenance costs.

Common Causes of High Percent Error and How to Reduce Them
High percent error rarely appears without a traceable cause. Identifying whether the source is systematic or random determines which corrective action will actually work.
Most Common Sources of Elevated Percent Error
Systematic sources tend to skew every reading in the same direction:
- Instrument wear or drift — mechanical wear in micrometers, calipers, and gauge blocks; electronic drift in sensors and transducers; optical degradation in laser systems
- Out-of-range use — measuring at the extreme ends of an instrument's scale, exceeding Maximum Permissible Error (MPE) specifications, or operating outside rated environmental parameters
- Failure to zero or calibrate — instruments not reset to known reference points, accumulated drift since last calibration, uncorrected offsets from previous use
Random sources vary between measurements and are harder to predict:
- Operator technique — inconsistent probing force or alignment, parallax errors on analog instruments, failure to allow parts to thermally stabilize
- Environmental factors — temperature fluctuations causing thermal expansion, vibration from nearby machinery, humidity affecting electronic sensors
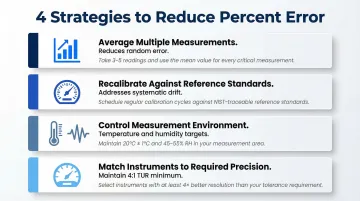
Strategies for Reducing Percent Error
Once you've identified the source type, the corrective approach becomes clear:
- Average multiple measurements to reduce random error — this increases confidence in the mean value but does nothing for systematic drift. Pair it with statistical process control to monitor variation over time.
- Recalibrate against verified reference standards on a regular schedule — this addresses systematic drift directly, establishes documented traceability, and catches wear before it produces defects.
- Control the measurement environment — maintain temperature at 20°C (68°F) per ISO 1:2022, use vibration isolation tables for sensitive equipment, and keep humidity between 40% and 60%.
- Match instruments to the precision required — maintain a minimum 4:1 Test Uncertainty Ratio (TUR) and replace worn instruments before they fall out of specification.
What "Acceptable" Percent Error Looks Like
Acceptable percent error thresholds vary dramatically by application:
- First-year chemistry lab: ~5% may be acceptable for educational purposes
- Quality control environment: Under 1% typically required for production verification
- High-precision manufacturing: Parts-per-million range demanded for aerospace and medical devices
- Analytical chemistry: Under 0.5% required for certified laboratory results
The acceptable threshold depends entirely on the tolerance requirements of your application — so the right starting point is always the spec sheet, not a rule of thumb.
How Sarkinen Calibrating Can Help Minimize Measurement Error
Sarkinen Calibrating is a local precision calibration provider serving manufacturing operations in Portland, Oregon and Southwest Washington. Founded by Larry, a former machine operator who understands production realities firsthand, the company approaches calibration not as isolated equipment maintenance but as integrated solutions that increase production quality and efficiency.
NIST-Traceable Calibration Accurate to 1.0 Parts Per Million
Sarkinen Calibrating provides NIST-traceable calibration measurements accurate to 1.0 parts per million (one millionth of an inch per inch), well beyond the standard 10:1 ratio required for proper calibration. This exceptional precision gives manufacturers a verified reference point to detect and correct systematic error before it compounds into costly percent error across production runs.
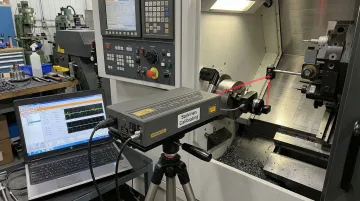
Using Renishaw's Laser Interferometer for linear calibration, the company measures positioning accuracy, repeatability, straightness, and squareness across the full travel of each axis. This level of accuracy ensures that even minute deviations are identified before they impact part quality.
Practical Benefits for Manufacturing Facilities
- Catch instrument drift early — Identifies systematic error before it inflates percent error across an entire production run, preventing undetected bias from turning precision parts into expensive scrap.
- Verify new machines under warranty — Shipping and installation introduce alignment errors and hidden damage. Confirming that new machines meet promised specifications while still under warranty ensures corrections happen at the supplier's expense.
- Faster local response times — Local service means less unplanned downtime compared to out-of-area providers, keeping equipment output accurate and production schedules intact.
Frequently Asked Questions
Does percent error measure accuracy or precision?
Percent error measures accuracy—it quantifies how close a measured value is to the true value. Precision describes the repeatability of measurements and is better expressed through standard deviation or the spread of repeated results.
What is a good percent error in an experiment?
"Good" percent error depends entirely on context. General lab experiments may accept ~5%, analytical chemistry may require under 0.5%, and precision manufacturing may demand parts-per-million accuracy. The acceptable threshold is set by the tolerance requirements of your specific application.
What is the difference between percent error and percent difference?
Percent error compares a measured value to a known true value, while percent difference compares two measured values to each other when neither is known to be definitively correct. Percent error requires a verified reference standard; percent difference does not.
What causes high percent error in measurements?
The main causes are instrument drift or miscalibration (systematic error), inconsistent operator technique, environmental interference (temperature, vibration, humidity), and using instruments outside their rated range or without proper zeroing before use.
Can percent error be negative?
Yes, percent error can be negative when the measured value falls below the true value, provided you don't apply absolute value in the formula. Many fields use absolute value to ensure positive results for easier comparison. Check the convention for your specific application.
How does calibration reduce percent error in manufacturing?
Calibration corrects systematic instrument errors by comparing a device's output to a verified reference standard and eliminating consistent bias. This reduces percent error in every measurement the instrument takes, preventing drift from accumulating into out-of-tolerance parts.