Introduction
When your CNC machine comes back from calibration, the certificate shows a number — but what does that "±0.003 mm" figure actually mean? For machine shop operators and manufacturing floor staff, this isn't academic. Decisions about whether a machine passes or fails, whether parts meet spec, and whether production can continue all hinge on understanding this figure.
That ± value is calibration uncertainty — the measured margin of doubt surrounding every measurement. Many machinists confuse uncertainty with error, treat it like a tolerance, or ignore it entirely — mistakes that can lead to scrapped parts, rejected batches, or false confidence in out-of-spec equipment.
Understanding where uncertainty comes from — and how to minimize it — is what separates confident production decisions from expensive guesswork.
What Is Calibration Uncertainty?
Calibration uncertainty is the quantified "doubt" surrounding any measurement result — the range within which the true value is estimated to lie, expressed alongside a stated confidence level. According to the Guide to the Expression of Uncertainty in Measurement (GUM), it is "a parameter, associated with the result of a measurement, that characterizes the dispersion of the values that could reasonably be attributed to the measurand" (the quantity being measured).
No measurement is ever perfectly exact. Uncertainty quantifies how much "wiggle room" exists around a reported value.
How Uncertainty Is Expressed in Practice
Two components are always required:
- The uncertainty interval — the ± figure
- The confidence level — typically 95%
Example:
A machine axis measures 10.000 mm ± 0.003 mm at 95% confidence means there is 95% confidence the true value falls between 9.997 mm and 10.003 mm.
This is reported on calibration certificates as the expanded uncertainty (symbol: U), obtained by multiplying the combined standard uncertainty by a coverage factor (k), usually k = 2 for ~95% confidence.
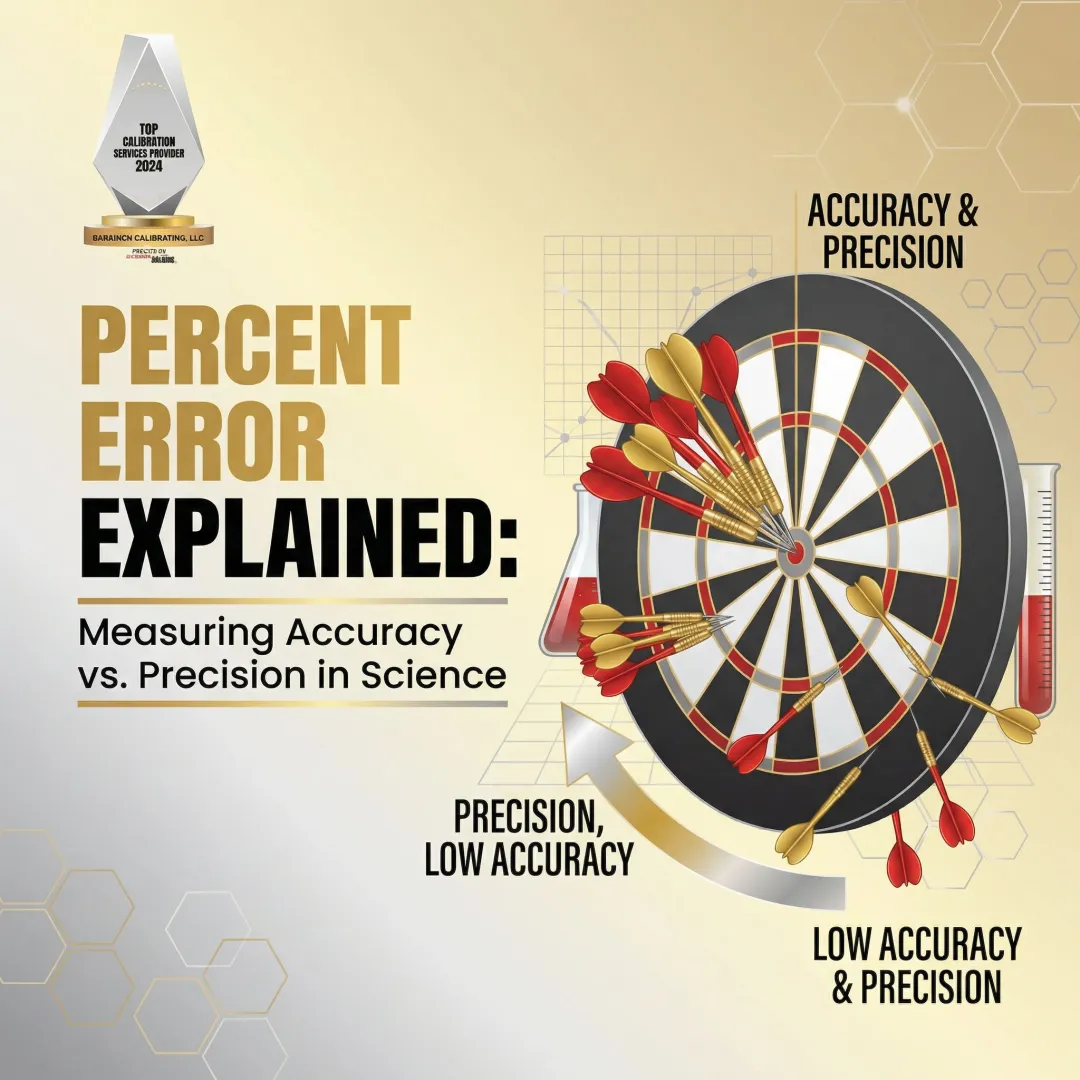
Calibration Uncertainty vs. Error: A Critical Distinction
Error and uncertainty are not the same, even though the terms are frequently confused.
| Concept | Definition | Correctability |
|---|---|---|
| Error | The known difference between a measured value and the reference (true) value | Yes — can be corrected via calibration offsets or software compensation |
| Uncertainty | The remaining doubt that cannot be fully eliminated, even after corrections | No — can only be minimized, never eliminated |
Recognized systematic errors (biases) should be corrected. The GUM notes, however, that "the systematic error cannot be known perfectly, [so] the compensation cannot be complete." The uncertainty of that correction remains and must be included in the overall uncertainty budget.
Calibration uncertainty is also frequently confused with related — but distinct — concepts:
- Not operator mistakes — blunders are separate from uncertainty
- Not tolerances — tolerances are acceptance limits you set for a product or process
- Not specifications — manufacturer specs are generic performance claims, not calibration uncertainties
The Compliance Statement Problem
When a calibration result is compared to a tolerance, the uncertainty band matters. If the uncertainty interval overlaps the tolerance limit, a definitive pass/fail cannot be stated.
Example:
- Part tolerance: ±0.005 mm
- Measured value: +0.004 mm
- Expanded uncertainty: ±0.002 mm
- Result range: +0.002 mm to +0.006 mm
The upper end exceeds the tolerance. This is Measurement Decision Risk — the risk of falsely accepting a bad part or falsely rejecting a good part.
ISO/IEC 17025:2017 (Clause 7.8.6) requires calibration labs to document and apply a decision rule when making pass/fail statements. ILAC G8:2019 provides international guidance on these rules — including how guard bands narrow the acceptance limit below the specification limit to account for measurement uncertainty.
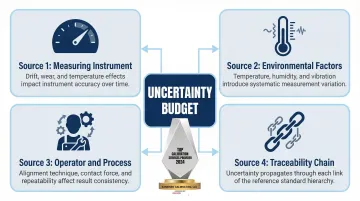
Where Does Calibration Uncertainty Come From?
Calibration uncertainty arises from multiple sources. The GUM (Clause 3.3.2) categorizes them into four practical groups that map directly to machine shop environments:
1. The Measuring Instrument Itself
Instruments drift over time due to:
- Wear and aging
- Temperature effects
- Mechanical instability
Even a recently calibrated reference standard carries its own uncertainty from its calibration certificate, and that uncertainty feeds into every measurement made with it. When building an uncertainty budget, use the value from the certificate itself — not the instrument's nameplate spec.
2. Environmental Contributions
Temperature is the dominant environmental factor in dimensional metrology. ISO 1:2022 mandates 20 °C as the standard reference temperature for all dimensional measurements. Deviations cause dimensional shifts:
- Steel: Expands at ~12.0 µm/m·°C
- Aluminum: Expands at ~23.4 to 23.6 µm/m·°C
Example:
A 100 mm aluminum component measured at 25 °C (5 °C above standard) expands by approximately 0.012 mm (12 µm) — enough to push a tolerance-critical part out of spec.
Other environmental factors include:
- Humidity (affects steel corrosion and air refractive index)
- Vibration (impacts probe contact and repeatability)
- Air pressure (affects laser interferometry)
3. Operator and Process-Related Sources
How a measurement is set up matters:
- Alignment errors
- Probe contact force variation
- Reading of scales (parallax errors)
- Repeatability of the process
Random variation in repeated readings — the "spread" of results — directly reflects this component of uncertainty.
4. Traceability Chain Uncertainty
The uncertainty from the reference standard used to calibrate an instrument propagates into every downstream measurement. The longer and less rigorous the traceability chain, the larger this contribution becomes.
NIST-traceable calibration ensures reference standards carry a known, documented uncertainty inherited from national measurement standards. This limits the uncertainty contribution from the reference instrument and gives reported results a defensible, internationally accepted basis.
Sarkinen Calibrating provides measurements traceable to NIST and/or International Standards, using Renishaw's Laser Interferometer with accuracy to 1.0 parts per million (one millionth of an inch per inch) — this exceeds the 10:1 accuracy ratio required for proper calibration and directly reduces the uncertainty passed into customer results.
Type A vs. Type B: Two Ways to Evaluate Uncertainty
The GUM defines two methods for evaluating uncertainty components:
Type A Evaluation: Statistical Methods
Uncertainty estimated by taking repeated measurements, calculating the mean and standard deviation, and deriving the standard uncertainty of the mean.
Characteristics:
- Captures random variation
- Requires a minimum number of repeated readings (typically 4–10) to be reliable
- Reliability depends on degrees of freedom — small sample sizes require adjusting the coverage factor using the t-distribution
Example:
Measure a gauge block 10 times. Calculate the standard deviation of those readings. The standard uncertainty of the mean is the standard deviation divided by the square root of 10.
Type B Evaluation: Non-Statistical Methods
Uncertainty estimated from any other available information:
- Calibration certificates
- Manufacturer specifications
- Known physical constants
- Past experience
Characteristics:
- Captures systematic influences that repetition alone cannot reveal
- Example: the stated uncertainty of a reference standard from its calibration certificate
Both Types Are Combined
In real calibration work, both types are almost always needed and are combined to produce the total uncertainty estimate. Together, they account for what the other misses — random scatter from Type A, systematic influences from Type B.
The GUM states that "A" and "B" refer to evaluation methods, not to fundamentally different kinds of uncertainty. Both are expressed as probability distributions and quantified by variances or standard deviations — and both are treated identically when calculating combined standard uncertainty.
How Calibration Uncertainty Is Calculated
Calibration labs worldwide follow the GUM framework (JCGM 100:2008) — the internationally accepted standard for calculating and reporting measurement uncertainty.
Core Logic (Without Overwhelming Math)
Identify all sources of uncertainty — instrument, environment, operator, reference standard
Estimate the size of each — using Type A (statistical) or Type B (non-statistical) methods
Convert to standard uncertainties — express all in consistent units
Combine using root-sum-of-squares — for uncorrelated (independent) sources:
$$u_c = \sqrt{u_1^2 + u_2^2 + u_3^2 + \ldots}$$
Multiply by a coverage factor — to obtain expanded uncertainty at a stated confidence level
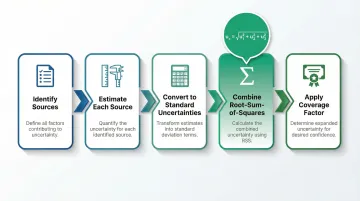
Step 5 — the coverage factor — is what converts a raw combined uncertainty into the ± figure that actually appears on your calibration certificate.
The Coverage Factor (k)
The combined standard uncertainty ($u_c$) is multiplied by a coverage factor (k) to produce the expanded uncertainty (U). This is the ± figure reported on calibration certificates.
| Coverage Factor (k) | Confidence Level | Typical Use |
|---|---|---|
| k = 1 | ~68% | Standard uncertainty; scientific reporting |
| k = 2 | ~95% | Standard for industrial calibration certificates |
| k = 3 | ~99.7% | Critical applications (health/safety) |
Put together, those three elements — measurement result, expanded uncertainty, and coverage factor — form the complete statement you'll see on any accredited calibration certificate.
Final Reporting Format
The final result is always reported with three elements:
Example:
50.000 mm ± 0.005 mm, k = 2, 95% confidence
That statement tells you the true length falls between 49.995 mm and 50.005 mm — with 95% confidence. For most manufacturing tolerances, k = 2 is the right benchmark to verify your equipment against.
What Calibration Uncertainty Looks Like on a Certificate
A professionally issued calibration certificate will state the expanded uncertainty alongside each measurement result, along with the coverage factor and confidence level used.
What to Look For
ISO/IEC 17025:2017 (Clause 7.8.4) requires accredited calibration certificates to include:
- Measurement uncertainty in the same unit as the measurand (or relative term)
- Environmental conditions that influence results
- Statement of metrological traceability (e.g., "Traceable to NIST")
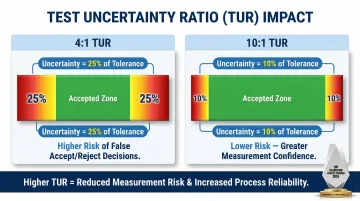
The 4:1 or 10:1 Test Accuracy Ratio
For a calibration to be valid, the calibrating instrument should be significantly more accurate than the instrument being calibrated — commonly a 4:1 or ideally 10:1 ratio.
Test Uncertainty Ratio (TUR) is defined by ANSI/NCSL Z540.3 as:
$$\text{TUR} = \frac{\text{Tolerance of unit under test}}{2 \times \text{Expanded uncertainty of calibration process}}$$
A higher TUR (e.g., ≥4:1) reduces the probability of false accepts (Consumer Risk), provided that all significant systematic errors (biases) have been corrected.
Why this ratio matters:At a 4:1 TUR, measurement uncertainty is 25% of the tolerance. At 10:1, it drops to just 10% — a meaningful difference in measurement confidence. Sarkinen Calibrating operates at 1.0 ppm accuracy, well beyond the 10:1 threshold, which translates directly to tighter, more reliable results for production-critical machines.
Common Pitfall: Nameplate Specs Are Not Calibration Uncertainties
Manufacturer accuracy specifications are generic performance claims. The expanded uncertainty on a calibration certificate, by contrast, represents the actual, statistically derived dispersion of the specific measurement process used during calibration — two very different things.
For traceability chains, always extract the expanded uncertainty (denoted U) directly from an ISO/IEC 17025-accredited calibration certificate. Nameplate specs don't substitute for it.
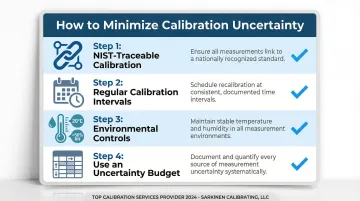
How to Minimize Calibration Uncertainty
1. Ensure NIST-Traceable Calibration
The single most effective step is ensuring all measurements are traceable through an unbroken chain to national or international standards (NIST in the U.S.).
Metrological traceability means a measurement result can be linked to a reference through a documented, unbroken chain of calibrations, each contributing to the overall uncertainty. Using reference standards calibrated directly by NIST or an accredited laboratory minimizes the uncertainty carried down from the top of that chain.
Sarkinen Calibrating provides measurements traceable to NIST and/or International Standards, and calibrates well beyond the 10:1 accuracy ratio — both of which directly reduce the uncertainty transmitted into customer calibration results.
2. Maintain Regular Calibration Intervals
Instruments calibrated on schedule — with historical stability tracked over time — allow calibration providers to account for drift and keep uncertainty contributions tightly controlled.
Measuring equipment performance changes over time due to wear and environmental exposure. ILAC G24 provides guidelines for recalibration intervals, noting that instrumental drift must be accounted for across each interval. Longer gaps between calibrations increase the risk of decreased reliability and wider uncertainty.
3. Implement Environmental Controls
Keeping measurement environments temperature-stable, vibration-free, and within specified humidity ranges reduces the environmental contribution to uncertainty.
Practical guidance for manufacturers:
- Temperature: Maintain 20 °C ± 0.25 °C over 24 hours for high-grade dimensional work (per NIST Handbook 150-2F)
- Humidity: Keep relative humidity below 50% to prevent corrosion of steel measuring equipment
- Vibration: Isolate precision measurement areas from production floor vibration sources
- Air pressure: Maintain stable atmospheric conditions for laser interferometry
4. Use an Uncertainty Budget
An uncertainty budget is a structured table documenting every contributing source, its estimated magnitude, and its type (A or B). It helps calibration professionals identify which sources dominate and where to focus reduction efforts.
A reputable calibration provider should be able to supply or explain this budget for your equipment. At minimum, look for:
- Itemized list of all uncertainty sources
- Estimated magnitude of each contribution
- Type A or Type B classification
- Combined standard uncertainty and expanded uncertainty calculations
Frequently Asked Questions
What is the principle of uncertainty in calibration?
The principle is that every measurement has an inherent margin of doubt — calibration uncertainty quantifies this doubt as a range within which the true value is believed to lie, at a stated confidence level (typically 95%), accounting for all known sources of variability in the measurement process.
How to calculate uncertainty of calibration?
Calibration uncertainty is calculated by identifying all contributing sources (instrument, environment, operator, reference standard) and estimating each using Type A (statistical) or Type B (non-statistical) methods. These are combined using root-sum-of-squares, then multiplied by a coverage factor (typically k = 2) to obtain expanded uncertainty at ~95% confidence, per the GUM framework.
What is the difference between calibration error and calibration uncertainty?
Error is the known, measurable difference between a reading and the reference value — it can be corrected. Uncertainty is the remaining unresolvable doubt about the result even after corrections: quantified as a range, not a single value, and can only be minimized, never eliminated.
What is a coverage factor in calibration uncertainty?
A coverage factor (k) is the multiplier applied to the combined standard uncertainty to produce an expanded uncertainty at a defined confidence level. k = 2 is most common, yielding approximately 95% confidence and defining the interval within which the true value is believed to lie.
How does NIST traceability affect calibration uncertainty?
NIST-traceable calibration ensures the reference standards used carry a known, documented uncertainty inherited from national measurement standards, limiting the uncertainty contribution from the reference instrument and providing a defensible, internationally recognized basis for reported calibration results.
What sources contribute most to calibration uncertainty in a machine shop?
The most common dominant sources are the uncertainty of the reference standard (calibrator), temperature and environmental variation in the shop, and the repeatability of the measurement process itself. All three can be reduced through proper calibration intervals, environmental controls, and working with a traceable calibration provider.
Final Takeaway:
Calibration uncertainty isn't just a number on a certificate — it's the foundation of every production decision you make. Understanding where it comes from, how it's calculated, and how to minimize it gives you control over quality, reduces scrap, and eliminates the false confidence that leads to rejected batches.
For NIST-traceable calibration services built to minimize measurement uncertainty, contact Sarkinen Calibrating at (360) 907-3058 or visit sarkinencalibrating.com/services.