Introduction
Precision manufacturing depends on instruments behaving predictably across their full measurement range. When a micrometer reads perfectly at 5 mm but drifts 0.02 mm undersize at 25 mm, that's a linearity problem—and it's one of the most critical yet commonly misunderstood properties checked during calibration.
Linearity errors don't announce themselves with alarm bells. An instrument still produces readings, operators continue production, and parts move through inspection. The problem surfaces weeks later: unexpected scrap, failed customer audits, or out-of-spec dimensions on parts that "should have been fine."
What follows breaks down what linearity actually means, why it matters on the shop floor, and how it gets evaluated during calibration.
TLDR
- Linearity means equal input changes produce equal output changes across an instrument's full measurement range
- Poor linearity lets errors accumulate toward one end of the range, producing defects and scrap before anyone notices
- Technicians measure linearity by comparing readings to reference standards at multiple points and calculating deviation from a straight line
- Acceptable tolerances vary by instrument and industry; statistical methods determine whether a gauge needs adjustment or repair
- NIST-traceable reference standards are essential for detecting small linearity errors that less precise equipment would miss
What Is Linearity in Calibration?
Linearity is straightforward in concept but critical in practice: a measurement instrument is linear when equal increments of the input produce equal increments of the output. A ruler illustrates this well — if the first inch measures true but the twelfth inch is stretched or compressed, the ruler isn't linear.
The Calibration Curve Concept
When calibration technicians test an instrument across its range using known reference standards, they plot the results on a graph with reference values on the X-axis and instrument readings on the Y-axis. A perfectly linear instrument produces a straight line with a slope of 1—meaning the instrument's reading matches reality at every point across its range.
In practice, real instruments deviate slightly from this ideal line. The question is: how much deviation is acceptable?
Linearity vs. Overall Accuracy
Linearity and accuracy are related but distinct — and confusing them leads to the wrong fix:
- Accuracy refers to how close a single reading is to the true value
- Linearity refers to whether that closeness is consistent across the entire measurement range
An instrument can be consistently inaccurate (biased) yet still perfectly linear—it reads 0.01 mm high at every point. Conversely, an instrument can read correctly at midrange but drift non-linearly at the high and low ends. This distinction matters because the fixes are different: bias requires offset adjustment, while non-linearity often indicates worn components or fundamental design issues.
Linearity Error Defined
Linearity error (also called deviation from linearity) is the maximum difference between an instrument's actual response at any point and the ideal straight-line response. This is typically expressed as a percentage of the instrument's full-scale range.
For example, if a 0–25 mm micrometer shows a maximum deviation of 0.005 mm from the best-fit line, the linearity error is:
(0.005 ÷ 25) × 100 = 0.02% of full scale
That 0.02% might sound small — but across a production run of hundreds of parts, it compounds.
How Linearity Relates to Other Calibration Parameters
Knowing where linearity fits among other calibration parameters helps pinpoint which type of error is actually affecting your measurements:
| Parameter | What It Measures | Example |
|---|---|---|
| Bias | Systematic offset from true value | A dial indicator consistently reads 0.01 mm larger than a master gauge block |
| Repeatability | Consistency of repeated readings | An operator measures the same shaft 10 times and gets slightly different results |
| Sensitivity | Smallest detectable input change | The physical limit of a probe's ability to detect surface deviation |
| Linearity | Consistency of bias across the range | A micrometer reads perfectly at 5 mm but 0.02 mm undersize at 25 mm |

During a full calibration, linearity is checked as its own separate test. An instrument can pass repeatability and bias checks at a single test point and still produce out-of-tolerance parts at the high or low end of its range — the kind of error that shows up as scrap, not as a failed calibration report.
Why Linearity Matters for Manufacturing Accuracy
Poor linearity in manufacturing creates a specific kind of problem: an instrument that reads correctly in one part of its range but drifts at the extremes. Parts measured in that drifting zone come out wrong—with no alarm, no error message, nothing to flag the issue until a quality problem surfaces downstream.
The Production Consistency Problem
In CNC machining and precision manufacturing, tools and instruments operate across their full measurement range constantly. A small-diameter shaft might measure 10 mm, while a large bore measures 150 mm—both checked with the same caliper. If that caliper has a linearity error of just 0.003 mm at the upper end of its range, parts measured there will be out of tolerance while smaller parts measure perfectly.
This is exactly the kind of problem that causes unexpected scrap, rework, and failed quality audits. Because the error is range-dependent, troubleshooting becomes difficult: some parts pass, others fail, and the pattern isn't immediately obvious.
The Hidden Cost of Undetected Measurement Error
Linearity errors don't usually cause obvious failure—instruments still produce readings, displays still light up, and production continues. They tend to go undetected until a quality problem surfaces downstream: customer complaints, warranty returns, or rejection during final inspection.
Research from the automotive industry demonstrates the financial impact: optimizing acceptance limits to account for measurement uncertainty reduced total decision costs by 15% to 19% by eliminating false rejects and preventing defective parts from shipping. When linearity errors skew measurements near specification limits, the result is predictable: good parts get rejected, defective parts get shipped.
Sarkinen's Shop-Floor Perspective
Those downstream costs—scrap, complaints, rejected shipments—are exactly what Larry, founder of Sarkinen Calibrating, spent years dealing with as a machine operator before building his calibration service. For him, linearity isn't an abstract metrology concept. It shows up in scrap rates, customer complaints, and unplanned downtime. That operator background shapes how Sarkinen approaches calibration: not as routine equipment maintenance, but as a direct lever on production quality and efficiency.
How Linearity Is Measured and Tested
Valid linearity testing requires a strict, statistically sound protocol to ensure bias variations are accurately mapped across the entire measurement envelope.
The Testing Process
According to both AIAG MSA 4th Edition and NIST Engineering Statistics Handbook standards, proper linearity testing follows this methodology:
- Select reference standards — Choose a minimum of 5 parts or reference standards whose measurements cover the full expected operating range in roughly equal increments
- Perform repeated measurements — Measure each reference standard at least 10 times
- Randomize the order — Measure parts in random sequence to minimize appraiser recall bias and ensure statistical independence
For example, testing a 0-25 mm micrometer would involve reference gauge blocks at 5 mm, 10 mm, 15 mm, 20 mm, and 25 mm, each measured 10 times in random order.
Graphing and Regression Analysis
You plot measured values against the known reference values, then fit a least-squares regression line through those data points to find the best-fit straight line. The slope and intercept reveal whether the instrument behaves linearly:
- Slope close to 1 indicates proportional response
- Intercept close to 0 means minimal systematic offset
- Data points clustered tightly around the line indicate good linearity
Statistical Measures: R and R²
Once the regression line is established, two statistics tell you how meaningful it is. The correlation coefficient (r) measures the strength of the linear relationship — values close to 1 or -1 indicate a strong relationship, while values near 0 indicate weak correlation.
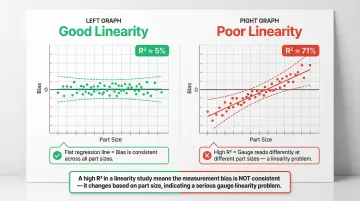
The coefficient of determination (R²) indicates the percentage of variation in the output explained by the linear relationship. However, there's a critical misconception here that trips up many quality managers.
The R² Misconception: A high R² in a linearity study is actually a bad sign. If a gauge is perfectly linear and properly calibrated, bias should be random noise around zero—resulting in a low R² value. A high R² (e.g., 71.4%) proves there's a definitive, predictable relationship between part size and bias amount—meaning the gauge has a severe linearity problem.
Acceptance Criteria
For linearity to be acceptable, the "bias = 0" line must lie entirely within the 95% confidence bands of the fitted regression line. If the confidence bands cross the zero line, linearity is unacceptable.
The largest deviation from the best-fit line, expressed as a percentage of full-scale range, is the instrument's linearity error. If this exceeds the tolerance specified for the instrument type, the instrument fails the linearity check.
What Happens When Linearity Fails
When an instrument fails linearity testing, it may need recalibration, adjustment, or repair. Sarkinen Calibrating's NIST-traceable measurements—accurate to 1.0 parts per million—provide the reference standard precision needed to reliably detect linearity errors that less precise calibration equipment would miss. That precision matters: at the 10-to-1 ratio the industry considers minimum acceptable, small but real linearity errors can slip through undetected and quietly bias an entire production run.
Common Causes of Non-Linearity in Measurement Equipment
When a gauge fails a linearity study, the root cause typically stems from physical wear, environmental factors, or flawed calibration practices.
Primary Causes of Non-Linearity
- Single-point calibrations assume a zero reading at zero input and draw a straight line through one verification point — masking inconsistent bias across the full measurement range
- Worn gauge internals — micrometer screw threads, rack-and-pinion gears in dial indicators, degraded spring tension — cause response to deviate non-linearly through the instrument's travel
- Signal processing flaws, non-linear sensor response curves, or component degradation in digital gauges produce non-linear outputs even when mechanical parts look fine
- Dropped instruments, thermal shock, contamination, or corrosion alter measurement surface geometry and introduce non-linear response patterns
- Reference standards with unknown or inaccurate values corrupt the entire linearity evaluation, making it impossible to separate instrument error from reference error
Errors tend to accumulate at the low and high ends of a gauge's range — not at the midpoint where most single-point checks are performed. Full-range linearity testing catches these drift patterns before they reach the shop floor.
The longer a non-linear instrument stays in service, the more parts it affects. Regular calibration schedules catch non-linearity early, before a single bad gauge compounds into a batch of rejected parts or a missed delivery.
What Is an Acceptable Linearity Range?
Acceptable linearity limits depend on the instrument type, its intended application, and the governing standard or specification. There is no single universal threshold—a precision CMM in aerospace manufacturing has tighter linearity requirements than a general-purpose shop-floor gauge.
How Tolerances Are Stated
Linearity error is commonly expressed as:
- Percentage of full-scale reading — e.g., ±0.1% of full scale
- Absolute units — e.g., ±0.0001 inches or ±0.002 mm
For example, ASME B89.1.13 specifies that a 0-25 mm outside micrometer has a maximum permissible error (MPE) of ±0.002 mm. For Coordinate Measuring Machines, ISO 10360-2 expresses MPE using formulas that account for the measured length, typically in the form E₀,MPE = ±(A + L/K).
The 10-to-1 Calibration Ratio Principle
Proper calibration requires that the reference standard used to check linearity be at least 10 times more accurate than the instrument being tested. This ensures the reference error doesn't mask or distort the instrument error being measured.
Modern standards have moved beyond the historical 10:1 Test Accuracy Ratio (TAR). ANSI/NCSL Z540.3 and ISO/IEC 17025 now recommend the Test Uncertainty Ratio (TUR), which accounts for the full expanded uncertainty of the calibration process. A TUR of 4:1 or greater is the current accepted minimum.
Two key distinctions:
- TAR (10:1) — compares instrument accuracy to standard accuracy only
- TUR (4:1 minimum) — accounts for all sources of uncertainty in the calibration process, making it a more complete measure
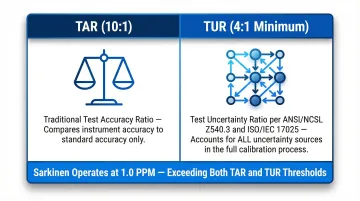
Sarkinen Calibrating operates at 1.0 parts per million (one millionth of an inch per inch), well beyond either threshold. That level of reference accuracy ensures linearity evaluations capture even subtle deviations across the full measuring range.
Frequently Asked Questions
What is linearity in calibration?
Linearity is the property of a measurement instrument where equal input changes produce equal output changes across its full range. Calibration verifies this by comparing readings against known reference standards at multiple points to determine whether measurement bias stays consistent or drifts as the measured value changes.
How do you measure linearity?
Linearity is measured by testing an instrument against at least 5 reference standards across its full range, measuring each 10+ times in random order, then performing regression analysis. The largest deviation from the best-fit straight line determines the linearity error.
What is the acceptable range for linearity?
Acceptable linearity depends on the instrument type and applicable standard, typically expressed as a percentage of full-scale range (e.g., ±0.1%). The measured linearity error is compared against the manufacturer's specification or regulatory requirement (such as ASME B89 or ISO 10360) to determine pass/fail.
What is the difference between linearity and accuracy in calibration?
Accuracy refers to how close a single reading is to the true value, while linearity refers to whether that closeness is consistent across the entire measurement range. An instrument can be accurate at midrange but non-linear at the extremes, or it can be consistently biased yet perfectly linear across its full range.
What causes non-linearity in a gauge or instrument?
Common causes include worn mechanical components (screw threads, gears), calibration performed only at midrange rather than across the full range, internal electronic design issues, physical damage from drops or thermal shock, and use of incorrect or degraded reference standard values during calibration.
How often should linearity be checked during calibration?
Linearity should be evaluated as part of every scheduled calibration. The calibration interval depends on the instrument's criticality, usage frequency, and manufacturer recommendations. Instruments used across their full measurement range in high-production environments require more frequent linearity checks to catch drift before it impacts part quality.
Need precision calibration services in Portland, OR or SW Washington? Sarkinen Calibrating provides NIST-traceable linear calibration with accuracy to 1.0 parts per million using Renishaw Laser Interferometer systems. Call (360) 907-3058 to schedule your calibration.